In this project, I have applied data cleaning, descriptive statistics analysis on job market dataset. Moreover, performed the correlations, applied bivariate analysis, and then summarized at the end.

In this project, I used SQL Server to explore global COVID 19 data.

In this project, I have explored and analysed sales data by using window functions, CTE, Temporary tables and many more.
In this project, I have explored unicorn companies data in SQL Server and then created Power BI dashboard.

In this project, I have explored hotel data in SQL Server and then made a dashboard in Power BI, which includes donut chart, line chart, slicers and many more.

In this project, I have cleaned Netflix data set, performed feature engineering, and also did exploratory data analysis to find some useful insights.

In this project, I cleaned the movies data of last 4 decades. Moreover, I plotted some graphs by using matplotlib and seaborn which shows the correlation of different variables and makes it more usable for analysis

Power BI dashboard on Adventure Works Cycles company in which I extracted, tranformed, and then loaded the data. After that I made some useful visuals after analysing the whole data.

Power BI dashboard on Global Superstore data. I have used slicers, maps, donut charts and many more to get some useful insights out of the raw data.

Power BI dashboard on CryptoCurrency. I have used line chart, slicers, maps, donut charts and many more to get some useful insights out of the raw data.

Power BI dashboard on Retail sales. I have used line chart, bar chart, slicers, maps, bubble chart and many more to get some useful insights out of the raw data.

Tableau Dashboard on COVID 19 dataset by using SQL Queries.

In this project, I took raw housing data and transform it in SQL Server to make it more usable for analysis.
In this project, I took tedTalk historial data from Kaggle. I did some exploratory data analysis in Python by using some advanced exploratory techniques.

In this project, I have done exploratory analysis on 1.5 million data about US accidents. Moreover, I have given some important information about accidents, which will be helpful to prevent accidents in future.

In this project, I cleaned the google play store data and have done exploratory analysis on it. Moreover, I have plotted different visuals,and summarized the data at the end.
In this project, I used Python libraries to explore the Titanic dataset and then built a Machine Learning's Logistic Regression model to predict the Titanic survivors.

In this project, I have collected the Russian tweets data, and then cleaned and explored to find its impact on US Presidential elections 2016.
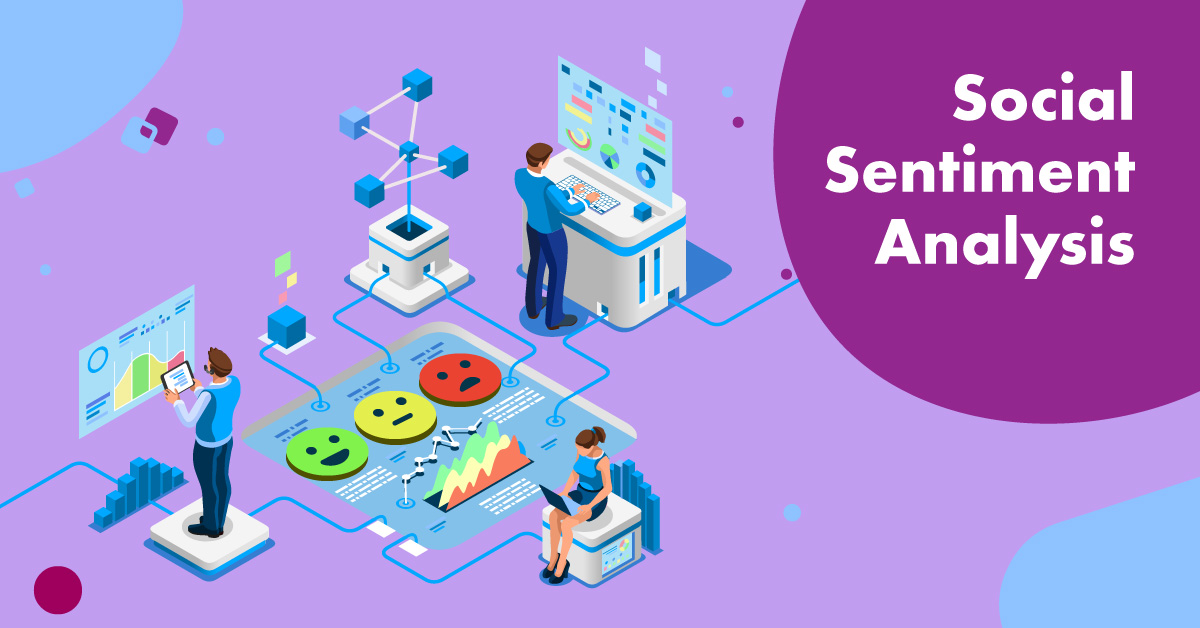
In this project, I used Natural Language Processing (NLP) in Python to analyze a piece of text to discover the sentiment hidden within it.

In this project, I have used Microsoft SQL Server to analyse the whole career of the footballer Lionel Messi.


